Sun provides the
Here's my approach to monitoring core (really vcpu or hardware thread) usage, divided into usr and sys. Add
which shows % usage per vcpu (or hardware thread) and it can be read via SNMP:
the above is from a Sun T2000 which has a Ultrasparc T1 with 8 cores and 4 hardware threads per core or 32 vcpus -- graphing then looks like this (alternate red and yellow bands for 32 x sys usage, green and yellow x 32 bands for usr usage):
note the peak over 3200 (8 cores x 4 threads per core x 100%) is due to the addition of max peaks of both usr and cpu (so a little misleading).

/usr/local/bin/corestat CLI tool for their CMT (T1 and T2 Ultrasparc) machines which outputs in a loop with a line per core, however the output isn't suitable for long-term monitoring and trending.Here's my approach to monitoring core (really vcpu or hardware thread) usage, divided into usr and sys. Add
exec vcpuidl /bin/sh /etc/snmp/conf/vcpuidl.sh to /etc/snmp/conf/snmpd.conf and the script /etc/snmp/conf/vcpuidl.sh is simply (mpstat is what corestat calls):
#!/bin/sh
/usr/bin/mpstat 1 2 | /usr/bin/awk 'BEGIN {RS="\n"; ORS="|"; } (NR>33) {print $13 "|" $14} END {print "\n"}'
which shows % usage per vcpu (or hardware thread) and it can be read via SNMP:
UCD-SNMP-MIB::extOutput.1 = STRING: usr|sys|0|0|0|0|0|0|0|0|0|0|0|0|0|0|0|0|0|1|0|0|0|0|0|0|0|0|0|0|0|0|0|1|0|0|0|0|0|0|1|1|1|0|0|0|0|5|0|0|0|0|0|0|0|0|0|0|0|0|0|0|0|0|0|0|
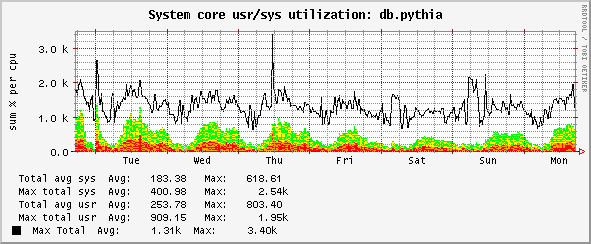
the above is from a Sun T2000 which has a Ultrasparc T1 with 8 cores and 4 hardware threads per core or 32 vcpus -- graphing then looks like this (alternate red and yellow bands for 32 x sys usage, green and yellow x 32 bands for usr usage):
note the peak over 3200 (8 cores x 4 threads per core x 100%) is due to the addition of max peaks of both usr and cpu (so a little misleading).