Monitoring webapplications, gathering statistics and graphing them for trending visualization is a well-known and common practice. Gross bandwidth, disk space usage, possibly hits per second based on mod_status output in Apache, free heap, user sessions from a servlet engine (like Tomcat) are all frequent measures of activity. However to get more complete timeseries data for custom or not so commonly monitored variables that are in a webserver access log in near-realtime requires some extra effort.
Timeseries graphing and data collection and consolidation is trivially done with a Round-robin Database, the most mature and useful, not to mention open-source of these is RRDTool. RRDTool consolidates the data over uniform time periods and so "bin-ing" the data is crucial. Out-of-the-box, webservers do not bin accesslogs, or at most at daily or hourly intervals. With cronolog on Apache, you can bin easily down to the minute (and perhaps even the second, though that is sort of silly in the cases I care about). With CTools, all the webserver traffic flows through a Netscaler load-balancer, which emits weblogs and rotates them up to once a minute. We use that to bin the data in 1 minute intervals and run a script out of cron (which doesn't have to parse timestamps making it much faster) to consolidate the data and slice and dice it into RRDs to produce graphs like these:

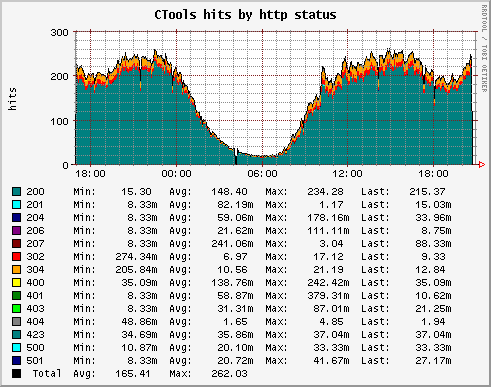
showing hits by http status stacked -- glitches in the application show up very quickly in this

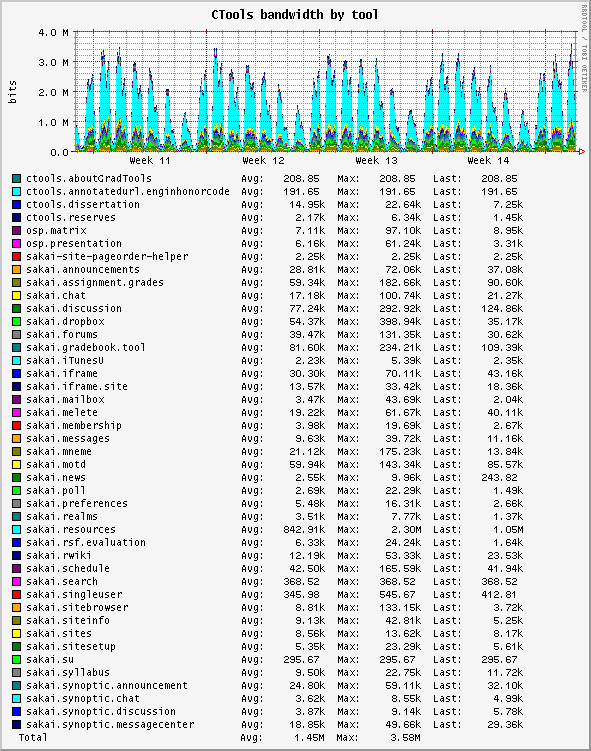
the bandwidth by tool graph shows some custom processing done on each hit to determine which Sakai "tool" it was for and the size of the response, again, near-realtime.
There are a whole lot of uncommon stats for web applications that we can graph this way, and it is very useful for trending.

Timeseries graphing and data collection and consolidation is trivially done with a Round-robin Database, the most mature and useful, not to mention open-source of these is RRDTool. RRDTool consolidates the data over uniform time periods and so "bin-ing" the data is crucial. Out-of-the-box, webservers do not bin accesslogs, or at most at daily or hourly intervals. With cronolog on Apache, you can bin easily down to the minute (and perhaps even the second, though that is sort of silly in the cases I care about). With CTools, all the webserver traffic flows through a Netscaler load-balancer, which emits weblogs and rotates them up to once a minute. We use that to bin the data in 1 minute intervals and run a script out of cron (which doesn't have to parse timestamps making it much faster) to consolidate the data and slice and dice it into RRDs to produce graphs like these:

showing hits by http status stacked -- glitches in the application show up very quickly in this

the bandwidth by tool graph shows some custom processing done on each hit to determine which Sakai "tool" it was for and the size of the response, again, near-realtime.
There are a whole lot of uncommon stats for web applications that we can graph this way, and it is very useful for trending.

1 comment:
In 2004, California legalized a type of roulette identified as|often known as} California Roulette. By regulation, the sport should use playing cards and never slots on the roulette wheel to choose the successful number. Just as in style as blackjack, roulette at Hard Rock offers an thrilling flooring expertise like no other on line casino in Cincinnati. Bet in your fortunate roulette numbers and hope for one of the best because the wheel spins. Of course, the chart does forego the cultural significance of a recreation like European Roulette and 카지노사이트 the history behind the beautiful recreation. Some could also be} drawn to traditional recreation sorts, and that's completely nice to do.
Post a Comment